Applying Filters to Study Adjacent “Neighborhoods”
Often we need to use information from the region around us to evaluate data. For example, standing in a Nebraska cornfield versus a valley in central Colorado, you might notice the difference in elevation characteristics of the “neighborhood” around you. The relief is the difference between the highest and lowest point. Can you do this in a GIS? Easy. Two ways.
- find the maximum elevation within a specified distance, then the minimum, and subtract the latter from the former.
- find the range of values within a specified distance.
These operations are known as “kernels” or “filters” or “focal statistics” in GIS-speak. In QGIS, you can find filters in the native SAGA library, and in plugin libraries, most notably PCRaster & Whitebox.
- min & max
- mean & median
- sum & range – highest value minus lowest value in the neighborhood
- standard deviation, of values in the neighborhood
- majority – cell value encountered the most times in the neighborhood (also known as a “mode filter”)
- minority – cell value encountered the fewest times in the neighborhood
- variety – how many different types of cell values in the neighborhood (also known as “diversity” in other GIS uses)
- Gaussian – reduce long-range variability in raster
- High-pass – highlight edges in a raster
- Adapative filter – smooths image, better than a mean filter for rpeserving original image features
all text in red comes from the Whitebox plugin. See here for more details
Can you think of a use for each one?
Filter or neighborhood operations differ greatly depending on whether they operate on discrete or continuous data.
Here I use the “filter” tool to look at elevation, although I don’t think the default 3×3 is a good choice for topographic analyses (try 5, 7, 9 or more).
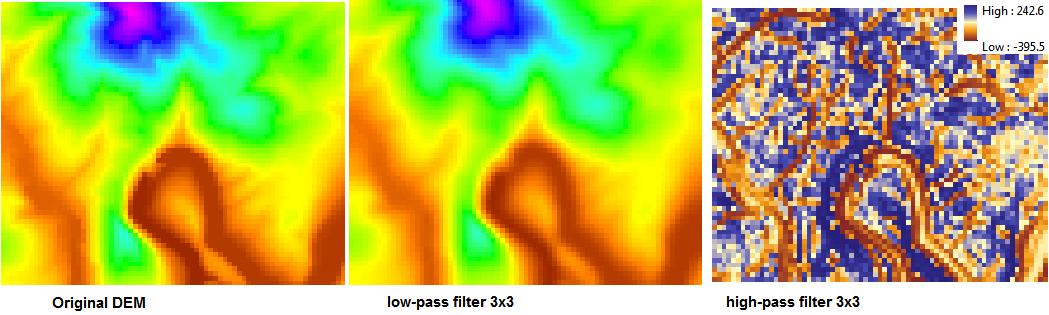
The high pass filter looks odd, but what it’s doing is highlighting edges better; note how well it picks out the edge of a cliff that otherwise is washed out in green in the low-pass image. High-pass filters can be sueful as you build visualizations of data, or try to identify morphological features,.
What size filter would you use to determine relief in the region around W&L, compared to that near Richmond?
Filtering Categorical Data
Which of the options are appropriate for categorical data?
Mean and Range should be replaced by Majority and Variety
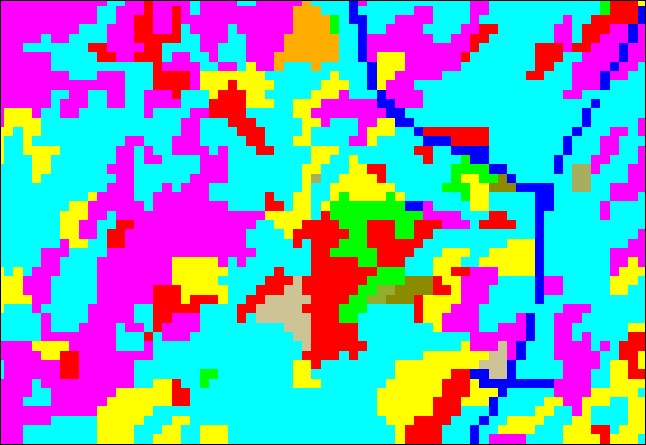
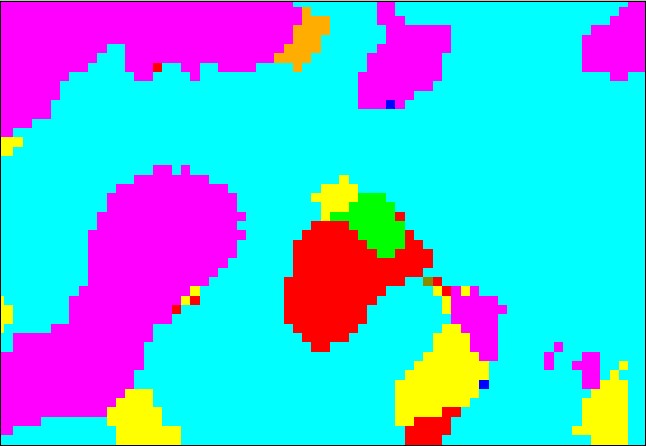
A Majority filter has the effect of simplifying the map, eliminating smaller patches of isolated cells like grow/shrink operations.
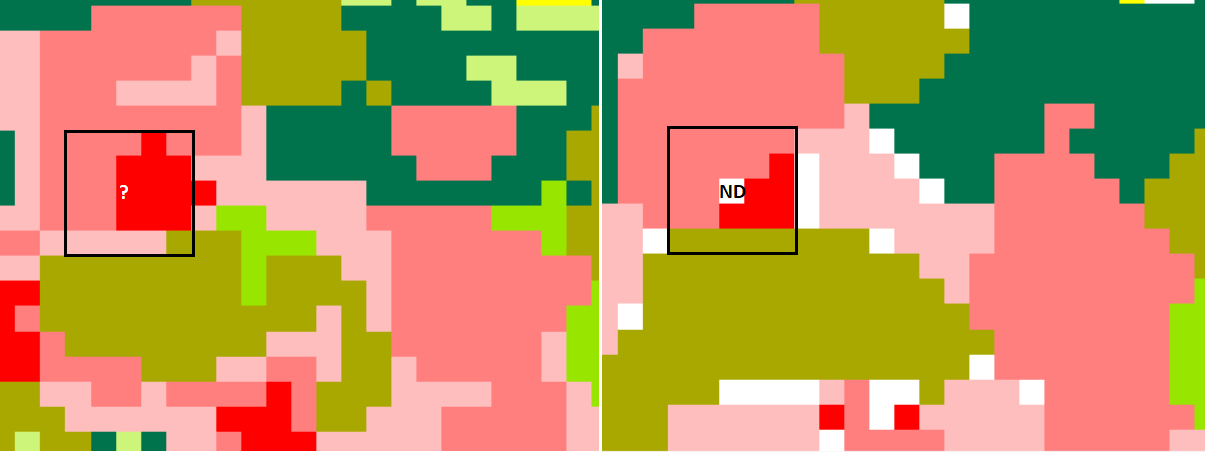
However, results can be unpredictable; in the NLCD data on the left, any place no majority arises becomes “NoData.” (10 pink=10 red). How could you “repair” this layer full of NoData holes?
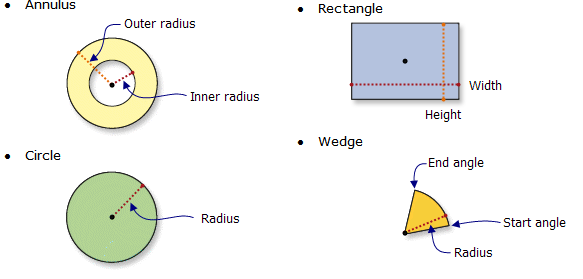
Neighborhood Shape
most GIS tools allow you to choose a different size and shape of the neighborhood that you’re sampling (of grids or points)
Block Analysis
This takes a similar approach to ratio and categorical neighborhood data, but the output is a degradation of the spatial variability. This is also possible with a resample analysis. In QGIS, we can use the windoowmajority filter (PCRaster) to emulate Arc’s block statistics tool; meanwhile, we can use Q’s natively built r.neighbors tool to perform focal statistics.
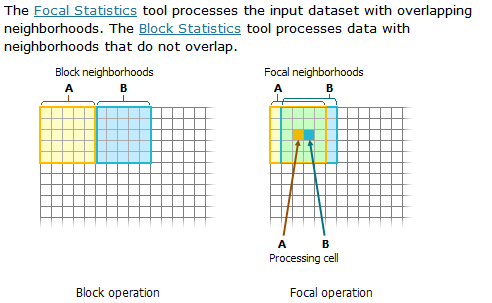
(from ESRI help files)